5-day weather forecast Niagara Falls 10-07-2026

Weather forecast Niagara Falls Friday, July 10 10.07.2026: light rain shower, temperature from 19 °C to 23 °C.

Precipitation probability 21%. Wind up to 3.31 m/s (gusts 5 m/s). Air humidity 86–98%, atmospheric pressure 758–761 mm Hg, UV index up to 1.6.

Sunrise 05:46
Sunset 20:56
Waning Crescent12% illuminated
Moonrise 01:29 · Moonset 17:10
Chart
Table

Forecast from 19 °C to 23 °C and precipitation

Temperature & Precipitation
Time00:0001:0002:0003:0004:0005:0006:0007:0008:0009:0010:0011:0012:0013:0014:0015:0016:0017:0018:0019:0020:0021:0022:0023:00
Temperature (°C)202020202020202021212121212222222223222222202019
Precipitation (mm/hr)00.08000.650.91.070.661.590.460.520.510.190.780.480.710.670.180.320.010000

Cloud cover and precipitation probability

Cloud cover & Rain chance
Time00:0001:0002:0003:0004:0005:0006:0007:0008:0009:0010:0011:0012:0013:0014:0015:0016:0017:0018:0019:0020:0021:0022:0023:00
Cloud cover (%)53576677786791916361657788100899493825587781215
Rain chance (%)212924266567766872525557416756636236372513152021

Wind speed and direction

Wind & Wind gust
Time00:0001:0002:0003:0004:0005:0006:0007:0008:0009:0010:0011:0012:0013:0014:0015:0016:0017:0018:0019:0020:0021:0022:0023:00
Wind (m/s)1.390.610.811.391.811.891.891.391.111.391.51.3111.191.111.392.52.813.312.8121.511
Wind gust (m/s)2.611.141.532.643.253.313.172.281.862.082.191.921.561.921.861.893.54.1754.283.222.831.941.97
Wind direction (°)SE 128°SSE 165°SSE 163°S 188°SSW 208°SSW 207°SW 221°SSW 209°WSW 245°W 263°WNW 298°WNW 299°WNW 303°NW 309°N 5°NNE 22°NNE 24°NE 43°NE 45°NE 53°ENE 62°ENE 60°NNE 23°NNW 340°

Air humidity

Humidity
Time00:0001:0002:0003:0004:0005:0006:0007:0008:0009:0010:0011:0012:0013:0014:0015:0016:0017:0018:0019:0020:0021:0022:0023:00
Humidity (%)939393939496989896949391908888878786868689939495

Atmospheric pressure

Pressure
Time00:0001:0002:0003:0004:0005:0006:0007:0008:0009:0010:0011:0012:0013:0014:0015:0016:0017:0018:0019:0020:0021:0022:0023:00
Pressure (mm Hg)758758758758758758758758758758758758758758758758758758758759759760761761

Ultraviolet index

UV Index
Time00:0001:0002:0003:0004:0005:0006:0007:0008:0009:0010:0011:0012:0013:0014:0015:0016:0017:0018:0019:0020:0021:0022:0023:00
UV Index000000000.10.40.70.911.41.61.30.90.80.30.20.1000

Air quality & pollen

Air quality
Time00:0001:0002:0003:0004:0005:0006:0007:0008:0009:0010:0011:0012:0013:0014:0015:0016:0017:0018:0019:0020:0021:0022:0023:00
PM2.5 (µg/m³)12.513.614.613.612.410.68.16.35.34.13.94.45.89.111.814.415.316.116.516.315.115.315.817.9
PM10 (µg/m³)12.813.9151412.8118.36.55.44.23.94.669.412.114.715.716.51716.915.715.916.418.5
Ozone (O₃) (µg/m³)938985817774716870789010311613114215015615715314413412210793
NO₂ (µg/m³)20.418.516.815.915.31515.516.21613.910.8864.43.32.82.73.13.64.66.711.216.920.5
SO₂ (µg/m³)3.93.83.73.844.24.655.35.45.45.35.14.84.54.13.83.53.33.33.444.85.3
CO (µg/m³)182206227236243253279309315274208157136129128132141150154158173217272297

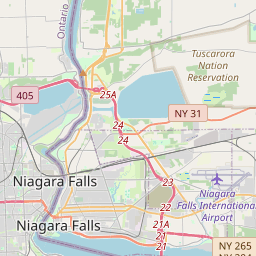
Niagara Falls on the map

Data Sources & Methodology

Our weather forecasts are powered by a professional weather data provider that aggregates data from national weather services, satellite observations, radar networks, and over 80,000 weather stations worldwide. Forecast data is updated multiple times daily. We convert raw data into clear summaries — wind speed in m/s, pressure in mmHg — so you can plan your day with confidence.